The estimated incidence of cancer increased by almost one third across Europe between 1995 and 2012, and this growth is predicted to continue.1,2 Compared with other diseases and disabilities, the lost years of life and productivity resulting from cancer represent a heavy drain on the global economy, especially in low- and middle-income countries, where the loss of income due to sickness or death is profound. In 2008, the total economic burden of cancer-related premature death and disability worldwide was US$895 billion (~€830 billion), with 85 million years of healthy life lost.3 Notably, these figures do not include the direct costs of cancer drugs. In Europe, health expenditure on cancer increased from €35.7 billion in 1995 (population size: 462 million) to €83.2 billion (population size: 510 million) in 2014, and spending on cancer drugs increased from €7.6 billion in 2005 to €19.1 billion in 2014 (current prices).4 As the incidence of cancer rises across the world, so does the amount of research and development into innovative medicines, signalling even higher costs in the future. As a result, the financial burden on society runs the risk of becoming unaffordable.5 It has been suggested that all governments declare how much is affordable, taking into consideration the country’s economic situation, and make a decision on what drugs and treatments can be made available as a basic healthcare provision for all, and which cannot.6
The economic burden of cancer care is a key component of the overall burden of healthcare, and on top of that, cancer drugs, in particular, have been associated with a dramatic increase in spending in recent years.7 This is due in part to the growing number of high-cost, newly approved drugs and the increasing pressure placed on oncology facilities. Over 70 new oncology treatments have been developed over the past 5 years, and it is estimated that by 2020, over 100 new cancer drugs could be approved.8 Administration of chemotherapy has shifted away from the lower cost setting of the physicians’ office, with a 30% increase in the number of infusions performed in higher cost outpatient settings between 2002 and 2014.9 An increase in the volume of cancer treatment is a further contributory factor. For example, in prostate cancer, the newer hormonal therapies abiraterone and enzalutamide significantly improve survival and are suitable for patients who cannot tolerate more toxic chemotherapies, such as docetaxel and cabazitaxel, meaning more patients can be treated.10 In multiple myeloma, several new, high-cost drugs have been approved in recent years, while the price of older drugs, such as melphalan, has also increased greatly over time.11 Treating multiple myeloma requires the use of multidrug combinations, and there is pressure to consider newer and more expensive proteasome inhibitors (i.e., carfilzomib and ixazomib) in place of bortezomib. Treatments are usually continued until progression, in the form of continuous or maintenance therapy. Several different classes of agents are now available for relapsed disease, which can be combined into various triplet regimens or used sequentially. Furthermore, as survival has improved by 7–10 years for standard-risk patients, the cumulative costs of care over a patient’s lifetime are substantial.11
The upward trend in spending raises questions about value for money and the future sustainability of cancer care, and presents significant challenges with respect to providing patients with access to treatments and effective new cancer medicines.12,13 For instance, a study of over 19,000 patients with melanoma found that while first-line, molecularly-targeted combination therapy for B-Raf proto-oncogene serine/threonine kinase (BRAF)-mutated metastatic melanoma was registered in 75% of Western European countries and fully reimbursed in 58%, the same treatment was registered in 42% of Eastern European countries and only reimbursed in 18%. In Eastern Europe, most patients are still treated with palliative chemotherapy that does not prolong overall survival.14 In many countries, proton beam facilities have a cost of around €35,000 per treatment series, and even more costly treatments are on the horizon.
Governments, decision-makers, healthcare providers (HCPs), patients and the pharmaceutical industry all need to make significant decisions about future spending, which must be informed both by knowledge about potential cost-drivers and what the consequences will be if healthcare expenditure remains unchecked. Therefore, the aim of this perspective article, the second in a series developed by a panel of experts in medical oncology, hospital pharmacy and health economics, is to raise awareness among the cancer community about the signals that indicate the risk of reaching the limits of sustainable cancer care, and to discuss the potential impact of reaching this ceiling of sustainability. The first paper addresses the reasons why the cost of cancer care is increasing and why this may be unsustainable unless changes are made.15
Defining sustainability in cancer care
We believe that sustainability can be defined using various parameters. Healthcare comes at a cost and not only will there be a limit, or ceiling, to the amount that people are willing to pay, but there will also be a limit to the national resources that are available. There may also be other factors within society that threaten sustainability, such as a lack of available human resources or budgetary priorities, whereby the funding of healthcare is weighed against infrastructure or education.
From an economic viewpoint, the ceiling of unsustainability is set at the point at which the cost of healthcare exceeds the benefit.16
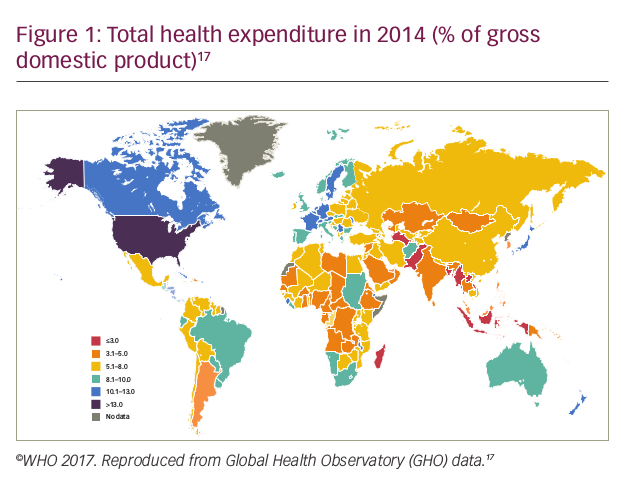
One statistic that can be used to define the ceiling of sustainability is the proportion of gross domestic product (GDP) spent on healthcare. Worldwide, total healthcare expenditure has now reached, on average, approximately 10% of GDP,17 and this value is likely to keep increasing. Currently the US and UK spend around 17% and 9% of their GDP, respectively, on healthcare. It has been suggested that by 2024 (US) and 2056 (UK), both countries will be spending one-fifth of their entire wealth on healthcare.18,19 How much is spent, as well as what is consumed in terms of healthcare, therefore varies enormously between countries (Figure 1).17,20 On average, high-income countries currently spend almost twice as much on healthcare as low- and middle-income countries,17 and this gap is likely to widen. Whether differences in expenditure always translate into improved outcomes, however, remains a matter of debate.21 Although the US spends more on health than any other country, life expectancy in the US is actually shorter than in other countries that spend far less.21 Setting such a high threshold for health expenditure may therefore not be the best precedent to follow.
Deciding what proportion of a nation’s income is spent on cancer care, and how much is spent on cancer drugs, will depend on a number of factors, including country-specific demographics, consumer/patient behaviour, treatment practices, technological progress, as well as health prices and productivity. The way that healthcare systems are organised will also play a part. Countries that have insurance-based systems, for example, may be likely to spend more than countries with tax-funded systems.18,22 To agree on a country-specific definition of sustainability, healthcare-specific decisions will need to account for projected costs of research and development, regulatory uncertainties in relation to efficacy, tolerance and overall cost-effectiveness, the extent to which a medicine meets a genuine unmet need, the likely market size, as well as differences in national GDP, income per capita and national healthcare budgets.23 While it is hard to determine to what degree each of these factors will contribute to setting a sustainability ceiling for cancer care; it appears that society is often willing to pay more for innovation and new technologies that significantly improve patients’ health and for which there is no therapeutically equivalent alternative.24 If these initiatives can help avoid surgeries, reduce hospitalisations and/or offset other medical costs, a higher ceiling may be justified.25 Without new policies, trade-offs may be necessary to ensure sustainability, which could lead to patients being denied access to effective cancer treatments.26
The sustainability of healthcare funding is a key public policy concern, as this will inevitably lead to policy discussions on prioritising healthcare above, for instance, spending on infrastructure, education or defence.
To help countries make difficult decisions on how cancer care is financed, choices need to be made based on the value of the intervention.
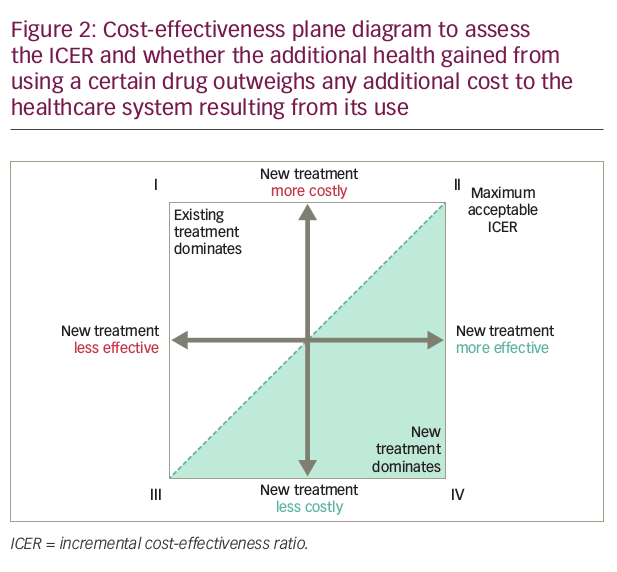
New interventions in cancer care are likely to be more costly and possibly more effective, but not necessarily proportionally better (Figure 2), because breakthroughs in medical procedures and new technologies are typically more expensive than existing practices.27,28 In these cases, whether an intervention is cost-effective or not depends on the threshold value, defined as the maximum amount society is willing to pay for an incremental health gain. A cancer drug that is more effective and more costly would only be considered cost-effective if its incremental cost-effectiveness ratio (ICER) is lower than the threshold value.29 In Figure 2, cancer drugs that have an ICER that lies to the south-east of the dotted line representing the threshold value (shaded in green) are cost-effective. Reimbursing such drugs maximises population health, subject to a budget constraint.
A possible approach to determine whether cancer care becomes unsustainable is to compare the ICER of a new cancer drug with the threshold value. A hypothetical calculation of an ICER is shown below for a new drug that costs €75,000 and extends survival threefold to
6 months, with a comparable quality of life (QoL) to the previous drug, which costs €25,000 and extends survival by 2 months.
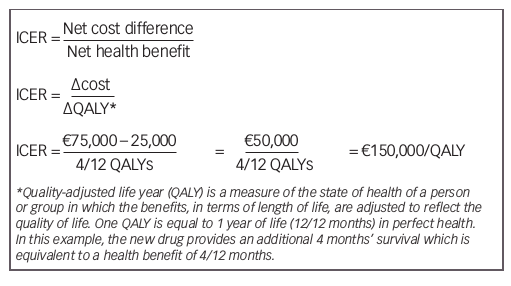
Based on current common cost-effectiveness thresholds of £20,000–30,000/QALY for the UK, US$50,000/QALY for the US, and €30,000/QALY for Spain,30–32 this drug would exceed the threshold value and would not be deemed cost effective.
For sequential therapy with high-cost agents, the optimal sequence of agents must be determined, balancing clinical effectiveness with cost effectiveness. A study that evaluated 18 different combination strategies (imatinib, dasatinib, nilotinib, bosutinib, ponatinib, stem-cell transplantation [SCT] and chemotherapy) for the treatment of chronic myeloid leukemia over a lifelong time horizon found that two strategies (imatinib nilotinib chemotherapy/SCT and nilotinib dasatinib chemotherapy/SCT) could be considered cost-effective for patients, depending on willingness-to-pay.33
If the ICER of a new cancer drug exceeds the threshold value and is reimbursed from the same budget as the previous drug, replacement of the previous drug with this new drug could decrease total population health, subject to the budget constraint.29 Thus, one could argue that reimbursing new cancer drugs that are not cost-effective is also unsustainable.
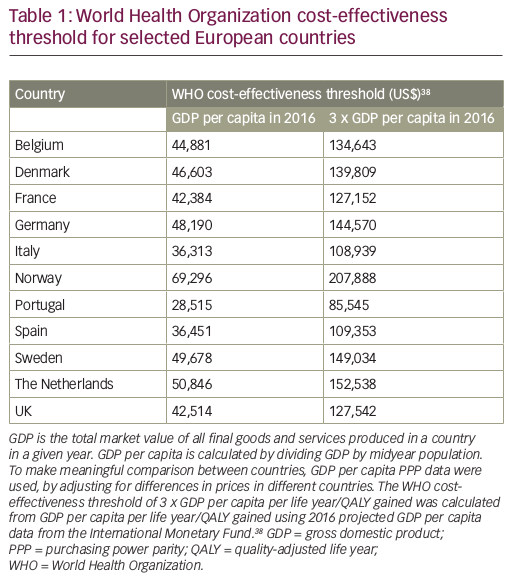
The threshold ICER approach has a number of weaknesses, including the fact that the decision rule to reimburse all health technologies that are cost-effective may generate an unsustainable growth in the budget.29 Also, it should be noted that health technologies can be assessed as cost-effective, but that does not necessarily mean that they are affordable.34 The World Health Organization (WHO) has attempted to provide an objective national threshold ICER that links per capita GDP of a country with returns on health investment, in order to define the characteristics of a cost-effective intervention.35 The WHO proposed that health technologies costing less than three times GDP per capita for each disability adjusted life year (DALY) averted are cost-effective and represent good value, while technologies meeting a threshold of the annual GDP per capita for each DALY averted are highly cost-effective.36 When this approach is adopted for more widely used health outcome measures, such as life years or QALYs, the WHO proposes the threshold is either three times GDP per capita per life year/QALY gained or is equal to the GDP per capita per life year/QALY gained.36
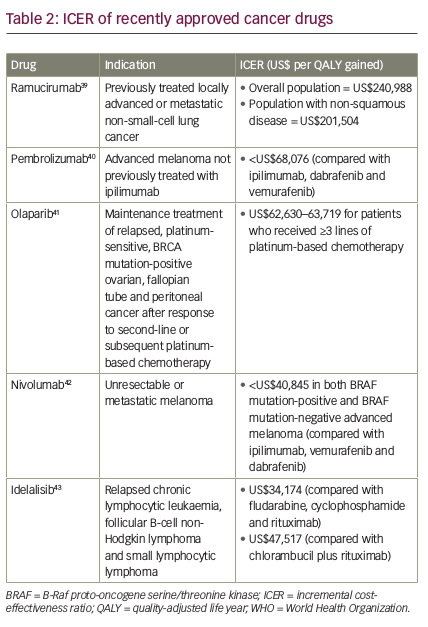
If we apply the WHO cost-effectiveness thresholds to some recently approved cancer drugs, we can see that ramucirumab (a human immunoglobulin G1 [IgG1] monoclonal antibody indicated for the treatment of patients with advanced or metastatic gastric or gastroesophageal junction adenocarcinoma with disease progression on or after prior fluoropyrimidine- or platinum-containing chemotherapy)37 exceeds the threshold of three times GDP per capita per life year/QALY gained in all countries, while pembrolizumab, olaparib, nivolumab and idelalisib are all below this threshold
(Tables 1 and 238–43). When the threshold is equal to the GDP per capita per life year/QALY gained, pembrolizumab and olaparib exceed the threshold in all countries except Norway, in which it is very close; nivolumab exceeds the threshold in Italy, Portugal and Spain and is close to the threshold in France and the UK; while idelalisib (at the higher ICER) exceeds the threshold in Belgium, Denmark, France, Italy, Portugal, Spain and the UK, and is close to the threshold in Germany and Sweden.
Based on the WHO willingness-to-pay threshold, it may be assumed that there is a direct relationship between the economic situation of a given country and drug availability.6 However, this is not always true and a wide gap between GDP and published cost-effectiveness decisions is evident in some countries. For example, adjuvant trastuzumab is deemed cost-effective in the high-income countries of Taiwan, Malaysia and Singapore. In Greece, where the economy is currently at risk, both the intravenous (IV) and subcutaneous formulations of trastuzumab are also considered cost-effective and the standard IV formulation is provided by the national health system. Among the key factors driving cost-effectiveness are the cost paid by the patients themselves, and the unit cost of human resources.
Cost-effectiveness analyses are often performed to evaluate prospective new interventions compared with current practice. However, this approach does not consider the costs and effectiveness of all possible interventions, in order to select the mix that maximises health for a given set of resource constraints. The WHO guidelines therefore recommend that analyses are performed for a wide range of interventions to provide general information on their relative benefits, in the absence of various highly local decision constraints. This information can serve as a useful reference point to guide resource allocation in a variety of settings.44
While costs of drug procurement and ICER thresholds can vary from country to country, the magnitude of clinical benefit of a drug, as derived from well-designed clinical trials, is a relative constant, although recently an overview of the added value of innovative drug treatments showed that on average, only modest contribution to survival may result.45 The European Society of Medical Oncology (ESMO) developed a tool that evaluates the clinical utility of oncology drugs based on efficacy, toxicity, QoL and survival, to support meaningful discussion of value and relative value. The aim of the ESMO Magnitude of Clinical Benefit Scale (ESMO-MCBS) is to differentiate treatments that bring substantial improvements to the survival and/or QoL of patients with cancer compared with the current standard of care, from those with more modest, limited or even marginal benefits. Drugs or treatment interventions that obtain the highest scores on the scale will be emphasised in ESMO guidelines, with the hope that they will be rapidly endorsed by health authorities across the European Union, thus improving patient access.46 Similarly, to provide patients with more transparent information about clinical impact, the American Society of Clinical Oncology (ASCO) established a value framework, which assesses the value of new cancer therapies based on clinical benefit, side effects, and improvements in patient symptoms or QoL, in the context of cost. All of these elements are combined into a score termed the net health benefit (NHB). Ultimately, patients will be able to modify the weight attributed to any of the elements included in the NHB depending on their personal preferences and circumstances. Information on the cost of the regimens will also be presented so the patient can consider the relative financial impact of their treatment options.47 The UK National Institute for Health and Care Excellence (NICE) currently uses a cost-effectiveness threshold of between £20,000 and £30,000 per QALY to gauge whether the health benefits offered by a new cancer drug are greater than the health likely to be lost because the additional resources required are not available to offer effective treatments to other patients.48 At this threshold, NICE currently recommends 6 out of 10 cancer drugs it appraises, although there is a wider ongoing debate about whether this threshold may be too high.
It is likely that resource-stratified guidelines and measures such as the ESMO-MCBS, ASCO Value Framework and NICE will encourage value-based pricing, whereby a market price is determined according to the medical benefit that the new intervention offers to patients. In anticipation of this, it is imperative that funding agencies, regulatory agencies and the pharmaceutical industry adopt more stringent value measures, including health economics and patient-reported outcomes, from the start of the drug development process.49,50
In any discussion of value, it is also important to define low-value care, in order to identify practices that offer insufficient value to patients to justify their continued use.51 These may include practices with evidence of a lack of clinical value, or which are less cost-effective compared with alternatives.
Potential impact of reaching the sustainability ceiling of cancer care
Signs within the health system that countries are at, or close to, the sustainability ceiling include: (1) increasing pressure for HCPs to balance the cost of cancer care with each testing or prescribing decision; (2) challenges from payer agencies on guideline-based decision-making; (3) challenging high cost phases in medical decision-making; and (4) overt cost-containment policies.
From a societal perspective, signals include debate on the limits of healthcare spending versus other societal priorities; overt or half-hearted discussions on limiting coverage; blaming physicians for irresponsible prescribing behaviour and variations in treatment; and ultimately defining an absolute percentage of GDP that healthcare spend can comprise.
The problem for individual HCPs, however, is knowing exactly where the sustainability ceiling for cancer care is and how close they are to reaching it in their specific country of practice at any given time; i.e. at what point changes need to be implemented.
Putting limits on the comprehensiveness of care is a common way to deal with cost pressures but may result in restricted access to treatment by making it impossible to treat certain patients or to provide the services they need. Withholding potentially beneficial treatments from some individuals becomes unavoidable because need is limitless and resources are not.52,53
When the cost of cancer care becomes unsustainable, countries may restrict health expenditure by limiting demand, cutting spending on administration, staff and services or by limiting investment in infrastructure, equipment or training. If hospitals are not properly reimbursed for the costs of cancer care, they cannot fund staffing or equipping of cancer units to treat more patients, and waiting times will rise.54 The challenge in this phase is to develop new, innovative treatments that either provide considerably more value than current treatments, or are available at a lower cost, and implement measures to contain and reduce expenditure without impacting on the quality of patient care. Such approaches may include minimising drug waste to reduce drug-related costs.55 A study in a single hospital in Italy found that 8.3% of the total expenditure on IV cancer drugs was attributable to drug waste.55
In low- and middle-income countries, where resources are even scarcer and research facilities may be less well-developed, physicians may be forced to provide suboptimal care to patients, despite knowing the optimal management strategy based on guidelines developed in higher-income countries. These countries will need to prioritise best practices in cancer treatment to address healthcare needs most effectively, and provide resource-stratified guidance on resource allocation to maximise health outcomes.56 It is suggested that given the high population burden of preventable cancers, these cancers should be prioritised in low-income countries, while in middle-income settings, risk reduction and adhering to the WHO essential list of medications is warranted.57
Reductions in the comprehensiveness of care may shift the financial burden to employers or households and will usually increase the role of out-of-pocket costs or co-payments in the health system. This has the potential for patients to delay seeking treatment and promote inefficiencies by encouraging people to use resource-intensive emergency services instead of cost-effective primary care.58 This also has the potential to increase personal debt in some countries. In the US, a population-based analysis found that the risk of bankruptcy for patients with cancer was about 2.7 times greater, compared with sociodemographically matched people without cancer.59 Patients who file for bankruptcy are more likely to be younger, female, non-white, and to have lower incomes, local- or regional- stage disease at diagnosis, and to have had received treatment. Severe financial distress after cancer diagnosis may also be a risk factor for mortality.60,61 In the US, a heavy financial burden or “financial toxicity” is increasingly recognised as impacting QoL and treatment adherence in patients with cancer. Those with multiple myeloma might be particularly vulnerable, due to the high use of costly novel treatments and the extended duration of treatment required.62
The increasing use of co-payments could also exacerbate inequalities in access to care. Given the chronicity of cancer and very high treatment costs, even moderate co-payments would mean that access to treatment could become dependent on a patient’s ability to pay.63 Evidence shows that young uninsured adults in the US are more likely to present with advanced disease, be undertreated, or die after a diagnosis of cancer compared with those who are insured,57 with co-payments potentially further increasing these disparities.
The effect of cost constraints on innovation is contentious. Some believe that undue pressure on health expenditure, together with a decline in economic return for the pharmaceutical industry, will adversely affect innovation by reducing the revenues available for research and development.24,64 On the other hand, reaching the sustainability ceiling may actually drive innovation, reinforcing the need to focus on value, i.e. providing the highest-quality care possible rather than as much care as possible. In times of budgetary constraints, innovations that offer too little benefit at too high a price cannot be justified.
The rising cost of cancer drugs is often justified by a perception that new is better, and the argument that drug development is a risk, and the return on investment must also cover the costs of drugs that fail. An increase in regulatory requirements and post-marketing obligations are further contributors to rising costs, and only small patient populations exist for some targeted therapies. However, this approach may be viewed as pharmaceutical companies being over-incentivised to spend heavily on risky ventures with the assumption that these costs can be passed on to the payer and patient, with no consequences for failure.51 Value-based pricing has been proposed as a policy that promotes access while rewarding innovation,65 and could encourage drug discovery, by avoiding the development of compounds with limited benefit while stimulating the development of new anticancer drugs with novel mechanisms of action.49
Conclusions
In recent years, huge progress has been made in cancer care, with advances in diagnostics and the development of new, ever more innovative treatments. However, this has come at a high cost, and in the coming years, global healthcare systems will approach the ceiling of being able to sustain high-quality cancer care.
The potential impact of reaching this ceiling of sustainability is severe. Countries may restrict health expenditure by limiting demand, cutting spending and reducing investment, which could result in restricted access to treatment by making it impossible to treat certain patients or to provide the services they need. Within Europe, each country is faced with making difficult decisions regarding how much of the country’s national resources should be devoted to cancer care, and how scarce resources should be allocated to meet the health needs of their patients. Determining the value of individual cancer drugs can help to inform these decisions, because it is clear that premium pricing for incremental innovation is no longer sustainable. New, innovative cancer treatments must offer considerably greater value or lower cost than current options, and measures are needed to contain and reduce expenditure and make best use of scarce resources, without impacting on the quality of patient care.