Breast cancer is the leading cause of cancer death in Hispanic women in the USA. According to the American Cancer Society, as many as one in nine Hispanic women will develop invasive breast cancer during their lifetime and one in 49 Hispanic women will die from invasive breast cancer.1 Female breast cancer is also the most common and leading cause of cancer death in Latin American and Caribbean countries, with an estimated 114,900 new diagnoses and 37,000 deaths each year.2,3
Patients who receive a cancer diagnosis are often faced with difficult decisions regarding their treatment and prognosis and thus they rely on multiple sources of information to make an informed decision. The internet is an increasingly important source of health-related information for patients in the USA and worldwide. According to a National Health Interview Study survey from 32,139 adults, approximately 43% reported searching the internet for health information.4 Fox and colleagues found that 83% of Hispanic adults living in the USA obtained health information from media sources, with 79% of those acting on the health-related information obtained from these sources.5
YouTube, a global repository of videos and social networking platforms, is a popular way for people to access health-related information, with over a billion hours viewed every day.6 According to a study conducted by the Pew Research Center, 72% of adults online use some form of video-sharing platform, of whom 63% use YouTube as a source of health-related information.7 A variety of online outlets – including advertisers, government agencies, news agencies, patient health portals, patients and health professionals – produce health-related videos and upload them to YouTube. However, several studies have questioned the quality and reliability of health-related information on YouTube.8–10 A study published in 2018 evaluating breast self-examination videos on YouTube found 54 out of 87 videos misleading.11
Objectives
While previous studies have evaluated the quality and reliability of online information in English, no studies have assessed the quality and reliability of YouTube videos in Spanish containing health-related information pertaining to breast cancer.11–16 For Spanish-speaking-only patients, who face language barriers in receiving health information, high-quality, reliable online health-related information that is available in Spanish is essential.17,18 Our main objective was to determine the quality and reliability of online videos in Spanish regarding breast cancer.
Methods
We conducted a descriptive analysis of Youtube videos using the search terms “cancer de mama” (translation: “breast cancer”) to investigate what patients would find when they are seeking information via YouTube. We chose these words over other options because this is the most broadly used set of words to describe breast cancer in Spanish. Search history, cookies and caches were cleared from the personal computers of the investigators to avoid any possible influence from prior browsing history. We created a new YouTube account in Harlingen, Texas. The first 200 video results from uniform resource locators of the search engine results page were transferred onto a playlist to avoid daily variances in search results using the default search filters. All inactive videos, duplicates, non-Spanish duplicates, or those with audio only, or without accompanying audio were excluded. Out of the initial 200 videos, a total of 173 were included in the study for further analysis. Twenty-seven videos (15%) were excluded because they had no audio (n=5), no relevant information (n=8), were in a non-Spanish language (n=10), in multiple parts (n=3) or were duplicates (n=1).
All videos were viewed in their entirety, with information collected from each video, including the number of ‘likes’, ‘dislikes’, total number of views, country of origin, video length and video upload date. Videos were categorized into one of five typology groups according to the source of upload: ‘commercial’ (for-profit companies), ‘government/news agencies’, ‘health portal’ (health information website), ‘personal’ (patient or family), and ‘Professional’ (university, hospital, physician groups or non-profit physician) (Table 1). The content of each video was assessed for the following: signs and symptoms, screening and detection, risk factors, diagnosis, research, treatment, reconstruction, survivorship/advocacy, and male breast cancer.
Table 1: Description of video typologies
| Typology | Description |
| Commercial | Videos that buy, sell or offer a service for a fee |
| Government/news agency | Videos created and/or managed by an official government body |
| Health portal | Videos created by an organization that offers health information on a variety of health topics |
| Personal | Videos created by individuals, patients and familes of patients |
| Professional | Video created by health professionals, experts and professional organizations |
Video quality and reliability were assessed using three validated tools. The Journal of the American Medical Association (JAMA) Benchmark Criteria utilizes four core standards to evaluate online health information and identify the essential components of transparency and reliability: authorship, attribution of references, currency and disclosure of any potential conflict of interest. A point is given for the presence of each criterion, with a minimum score of 0 and a maximum score of 4.4 The Global Quality Score (GQS) is a subjective tool graded on a 5-point Likert scale, with a score of 1 representing poor quality and not being beneficial for patients, and a score of 5 representing excellent quality and very useful for patients.19 The modified 5-point DISCERN score is a questionnaire used to evaluate the quality of information with a maximum potential score of 5 points indicating high quality and a minimum of 0 points indicating poor quality (Table 2). In summary, the JAMA score evaluates information reliability, while the GQS and DISCERN scores assess information quality. Combining the scores provides a broader portrait of the quality and reliability of the video, as a whole. Scores were generated by two internal medicine resident physicians who were fluent in English and Spanish (IL and DC) independently at different times, who also selected the videos from the original search. The corresponding Cohen’s kappa coefficients for GQS and DISCERN scores were 0.923 and 0.960, respectively. A third physician (FD) resolved any disagreements on scores.
Table 2: Evaluation tools for reliability and quality
| JAMA score (1 point per question if present; maximum 4 points) |
| 1. Authorship |
| 2. Attribution of references |
| 3. Currency |
| 4. Disclosure |
| Global Quality Score (choose one) |
| 1. Poor quality, poor flow, most information missing, not helpful for patients |
| 2. Generally poor, some information given but of limited use to patients |
| 3. Moderate quality, some important information is adequately discussed |
| 4. Good quality good flow, most relevant information is covered, useful for patients |
| 5. Excellent quality and excellent flow, very useful for patients |
| DISCERN score (1 point per question if answered yes; maximum 5 points) |
| 1. Are the explanations given in the video clear and understandable? |
| 2. Are useful reference sources given? (publication cited, from valid studies) |
| 3. Is the information in the video balanced and neutral? |
| 4. Are additional sources of information given from which the viewer can benefit? |
| 5. Does the video evaluate areas that are controversial or uncertain? |
JAMA = Journal of the American Medical Association.
The ordinal scales were used to measure the video quality and reliability scores. Since these measurements are in an ordinal scale, we summarize them using median and interquartile ranges (IQR). All numerical measures are summarized as median ± IQR and all qualitative variables were summarized as counts (percentages), as the best summary measures for categorical variables are percentages. The qualitative variables were recorded as percentages (year video uploaded, length of video, country of origin and typology). The differences in the quality and reliability measures were evaluated by typology using the Kruskal–Wallis (KW) non-parametric test.20 This is mainly due to having ordinal type measures (quality and reliability scores) for small sample sizes within certain typology categories, and hence not being able to satisfy the normality assumption to use the one-way analysis of variance.21 It should be noted that, in the KW test, we deal with either the median (when the data distribution has the same shapes) or mean rank (when the data distribution do not have similar shapes). In our case, the shape of the data distribution for JAMA, GQS and DISCERN scores, within typologies are not the same and hence we report the mean ranks. Bonferroni adjusted pairwise comparisons with Dunn test were used to identify the significant differences in the three scores, between each pair of typology.22 To detect a significant association among qualitative variables within each typology group, either the Pearson’s chi-square or Fisher’s exact tests were utilized.
Linear regressions were used to evaluate the impact of variables (number of likes, dislikes, duration of videos and number of views) on the three quality and reliability scores after adjusting for the typology and the contents of the videos. If the assumptions of linear regression models were not satisfied, a corresponding generalized additive model (GAM) was used to evaluate the impact of each variable. GAM provide a general framework for extending a standard linear model by allowing non-linear functions of each of the variables. All tests were two-tailed, and a 0.05 significance level was used to assess the statistical significance. Data analysis was performed using R (V.4.1.2).
Results
Approximately 4% of videos were uploaded before 2010, 31% uploaded 2010-2014, and 63.5% uploaded 2015-2019. The median length of the videos was approximately 5 minutes, with an IQR of 9.30. Approximately 48% of videos lasted less than 5 minutes, 19% were between 5 and 10 minutes, 20% were between 10 and 20 minutes, and 12% lasted longer than 20 minutes. The videos in our sample had a median number of views of 23,539. The median number of ‘likes’ per video was 159, with a range of 0–47,000 (IQR: 468). The median number of ‘dislikes’ was 10, with a range of 0–721 (IQR: 38). Most videos were published in Spain (36.4%), followed by Mexico (17.9%) and the USA (10.4%). Of the remaining videos, 26.6% were uploaded from 12 other Latin American countries and, in 8.7%, the country of origin could not be identified (Table 3)
Table 3: Video characteristics
| Year video uploaded | Total N=173 N (%) |
| <2010 | 7 (4%) |
| 2010 | 2 (1.2%) |
| 2011 | 17 (9.8%) |
| 2012 | 8 (4.6%) |
| 2013 | 10 (5.8%) |
| 2014 | 17 (9.8%) |
| 2015 | 16 (9.2%) |
| 2016 | 22 (12.7%) |
| 2017 | 26 (15%) |
| 2018 | 28 (16.2%) |
| 2019 | 18 (10.4%) |
| 2020 | 2 (1.2%) |
| Length of video |
|
| Median | 5.28 mins |
| Interquartile range | 9.30 |
| 0–5 minutes | 83 (48%) |
| 5–10 minutes | 33 (19%) |
| 10–20 minutes | 34 (20%) |
| 20–30 minutes | 15 (9%) |
| >30 min | 6 (3%) |
| Number of views |
|
| Median | 23,539 |
| Number of likes |
|
| Median | 159 |
| Range | 0–47,000 |
| Interquartile range | 468 |
| Number of dislikes |
|
| Median | 10 |
| Range | 0–721 |
| Interquartile range | 38 |
| Country of origin |
|
| Argentina | 10 (5.8%) |
| Brazil | 1 (0.6%) |
| Chile | 1 (0.6%) |
| Colombia | 8 (4.6%) |
| Costa Rica | 4 (2.3%) |
| Cuba | 1 (0.6%) |
| Dominican Republic | 2 (1.2%) |
| Guatemala | 1 (0.6%) |
| Mexico | 31 (17.9%) |
| Panama | 1 (0.6%) |
| Paraguay | 1 (0.6%) |
| Peru | 12 (6.9%) |
| Spain | 63 (36.4%) |
| USA | 18 (10.4%) |
| Venezuela | 4 (2.3%) |
| Unknown | 15 (8.7%) |
| Typology |
|
| Commercial | 13 (7.5%) |
| Government/ews agency | 43 (24.9%) |
| Health portal | 14 (8.1%) |
| Personal | 63 (36.4%) |
| Professional | 40 (23.1%) |
With regards to video typology, 63 videos (36.4%) were uploaded by patients or their family or friends (‘personal’), 43 videos (24.9%) by a government or news agency (‘government/news agency’), 40 videos (23.1%) by medical professionals (‘professional’), 14 videos (8.1%) by a stand-alone health portal (‘health portal’), and 13 videos (7.5%) by commercial companies (‘commercial’) (Table 3).
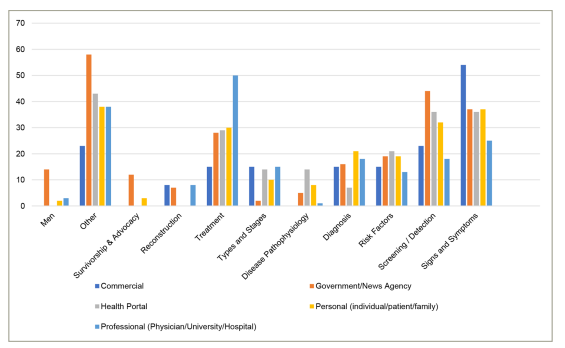
We next evaluated the distribution of video content based on their typology. Of the ‘professional’ videos, 50% focused on treatment modalities, while very few referenced breast reconstruction, survivorship and advocacy, or breast cancer in men. Videos that discussed signs and symptoms of breast cancer were mainly uploaded by ‘commercial’ typologies (54%), videos discussing screening and detection were uploaded primarily by ‘government/news agency’ (44%), and videos discussing risk factors were uploaded mostly by standalone ‘health portals (21%) (Figure 1).
Figure 1: Content of videos organized by typology (%)
The details of video characteristics were stratified by the source of upload as shown in Table 4. ‘Personal’ videos had the longest duration on average (8 minutes) while ‘health portal’ videos had the shortest average (2.8 minutes). No significant differences were found in the median time since upload among the different typology types (p-value: 0.053).
Table 4: Characteristics organized by typology*
|
| Commercial | Government/news agency | Health portal | Personal | Professional | p-value |
| N (%) | 13 (7.5) | 43 (24.9) | 14 (8.1) | 63 (36.4) | 40 (23.1) |
|
| Video length (mins) | 3.17 ± 1.0 | 7.21 ± 10.8 | 2.83 ± 4.2 | 8.00 ± 12.1 | 4.93 ± 8.1 | 0.003 |
| Time since upload (days) | 1936.0 ± 2087.0 | 1291.0 ± 1110.0 | 2026.5 ± 2399.0 | 986.0 ± 1390.0 | 1299.5 ± 2078.0 | 0.053 |
| Views | 39947.0 ± 173472.0 | 22808.0 ± 111208.0 | 26943.0 ± 86607.0 | 36489.0 ± 165906.0 | 8975.5 ± 25680.0 | 0.011 |
| Likes | 272.0 ± 536.0 | 100.5 ± 339.0 | 56.5 ± 187.0 | 383.5 ± 1036.0 | 53.0 ± 179.0 | 0.000 |
| Dislikes | 16.0 ± 45.0 | 10.0 ± 29.0 | 10.0 ± 20.0 | 17.5 ± 97.0 | 3.0 ± 11.0 | 0.000 |
*Values based on Kruskal–Wallis test and presented as median ± interquartile range.
The overall median JAMA score of all videos was 2, with a range of 0 to 3 (IQR: 0.00), in which 82.7% scored between 2 and 4 possible points. Only 3.5% of videos achieved 3 points, and no videos reached the maximum score of 4 points. The overall median GQS score was 2.00, with a range of 1 to 4 (IQR: 1.00). Approximately 21% of videos scored 1 point, 37% scored 2 points, 38% scored 3 points, 4% achieved 4 points, and no videos obtained all 5 possible points. The overall median DISCERN score was 2 with a range of 0 to 5 points (IQR: 2.00). Approximately 8% scored 0 points, 15% scored 1 point, 39% scored 2 points, 14.5% scored 3 points, 2.9% scored 4 points and only one video (0.6%) scored all 5 points (Table 5).
Table 5: Summary characteristics for quality and reliability scores
|
| JAMA | GQS | DISCERN |
| Median ± IQR | 2.0 ± 0.0 | 2.0 ± 1.0 | 2.0 ± 2.0 |
| Range | 0–3 | 1–4 | 0–5 |
| Points | Score N=173 (%) |
|
|
| 0 | 2 (1.2%) | N/A | 49 (28.3%) |
| 1 | 22 (12.7%) | 36 (20.8%) | 26 (15.0%) |
| 2 | 143 (82.7%) | 64 (37.0%) | 67 (38.7%) |
| 3 | 6 (3.5%) | 66 (38.2%) | 25 (14.5%) |
| 4 | 0 (0.0%) | 7 (4.0%) | 5 (2.9%) |
| 5 | N/A | 0 (0.0%) | 1 (0.6%) |
GQS = Global Quality Score;JAMA = Journal of the American Medical Association.
The correlation among the three reliability scores and the length of videos, likes, dislikes and views were calculated overall, and by typology (Figure 2). Overall, the length of the videos had shown a significant positive correlation with the GQS (r=0.28) and DISCERN (r=0.23) scores. Similar positive correlations for GQS and DISCERN scores were observed for length of videos within all typology types except for commercial videos (r=−0.56). Note that the JAMA score correlation was not calculated, as the scores were the same for all commercial videos.
Figure 2: Correlation matrices by quality and reliability tools and video characteristics
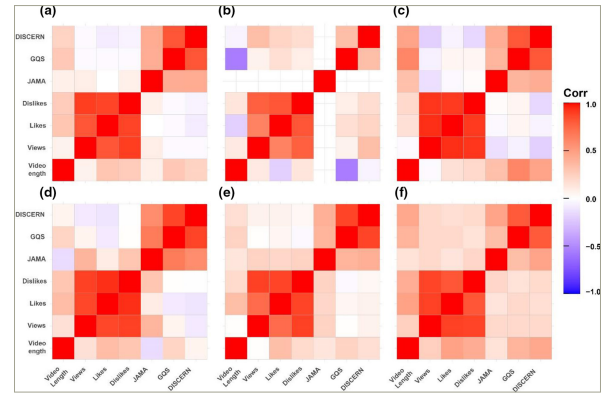
The correlation matrices among the variables of length of videos, likes, dislikes, views, Global Quality Score (GQS) and Journal of the American Medical Association (JAMA) Benchmark Criteria, and the Modified DISCERN Questionnaire scores for: (a) full set of videos; (b) commercial; (c) government/news agency; (d) health portal; (e) personal videos; and (f) = professional. Overall, length of the videos had shown a significant positive correlation with the GQS (r=0.28) and DISCERN (r=0.23) scores. Similar positive correlations for GQS and DISCERN scores were observed for length of videos within all typology types except for commercial videos (r=−0.56). Note that the JAMA score correlation was not calculated, as the scores were the same for all commercial videos.
The mean rank and median scores by the source of upload (typology) were analysed and are shown in Table 6. Notably, for the JAMA score, the mean rank for ‘professional’ videos was highest among typologies at 99.5 (standard deviation [SD]: 24.3) compared with 73.6 (SD: 37.3) for ‘personal’ and 71.0 (SD: 50.3), for ‘health portal’ the lowest. Concerning the GQS score, the mean rank for ‘professional’ was at 102.9 (SD: 40.7), 98.5 (SD: 44.9) for ‘health portal’ (second highest), and 72.3 (SD: 50.8) for ‘personal’, the lowest. Concerning DISCERN score, ‘health portal’ had the highest mean rank at 110.1 (SD: 48.9) followed by 101.1 (SD: 46.5) for ‘professional’ while ‘personal’ was lowest at 68.9 (SD: 48.2). Table 6 depicts the significant mean rank differences for JAMA, GQS, and DISCERN scores as identified by pairwise comparisons. We observe that the mean ranks of three quality and reliability scores between Professional and Personal to be significantly different with p-values: JAMA:0.001; GQS:0.013; and DISCERN: 0.009, respectively. Additionally, we found that the mean rank for JAMA between ‘government/news agency’ and ‘personal’ (p-value: 0.002) and the mean rank for DISCERN between ‘health portal’ and ‘personal’ (p-value: 0.002) was significantly different.
Table 6: Summary characteristics for quality and reliability scores by typology*
|
| Commercial | Government/news agency | Health portal | Personal | Professional | Kruskall–Wallis p-value |
| JAMA (0–4 points) |
| |||||
| Median ± IQR | 2.0 ± 0.0 | 2.00 ± 0.00 | 2.00 ± 1.00 | 2.00 ± 1.00 | 2.00 ± 0.00 | – |
| Mean rank ± SD | 96.0 ± 0.0 | 97.6 ± 20.6 | 71.0 ± 50.4 | 73.6 ± 37.3 | 99.5 ± 24.3 | 0.000 |
| GQS (1–5 points) |
| |||||
| Median ± IQR | 2.0 ± 1.0 | 2.0 ± 1.0 | 3.0 ± 1.0 | 2.0 ± 2.0 | 3.0 ± 1.0 | – |
| Mean rank | 89.6 ± 38.5 | 89.3 ± 45.6 | 98.5 ± 44.9 | 72.3 ± 50.8 | 102.9 ± 40.7 | 0.020 |
| DISCERN (0–5 points) |
| |||||
| Median ± IQR | 2.0 ± 2.0 | 2.0 ± 1.0 | 2.0 ± 2.0 | 1.0 ± 2.0 | 2.0 ± 2.0 | – |
| Mean rank | 79.5 ± 44.1 | 95.2 ± 41.2 | 110.1 ± 48.9 | 68.9 ± 48.2 | 101.1 ± 46.5 | 0.0002 |
*The assumption for one-way analysis of variance was not satisfied, hence the Kruskall–Wallis (KW) test was used. The mean ranks were used in the KW test, as the distribution of the data within each typology was not similar within each quality and reliability score measurement.
GQS = Global Quality Score;IQR = interquartile range;JAMA = Journal of the American Medical Association;SD = standard deviation.
As per GAM analyses, video length was the only variable that had shown a significant impact (p-value: 0.0002) on the DISCERN score, after adjusting for typology and the contents of the videos. None of the variables were associated with either the JAMA or GQS scores (Tables 7 and 8).
Table 7: Generalized additive models summaries for JAMA and DISCERN scores
| GAM model for JAMA score | |||||||
| ANOVA for parameter effects |
| DF | Sum Sq | Mean Sq | F value | Pr(>F) | Significance |
| Likes |
| 1 | 0.028 | 0.028 | 0.173 | 0.6780 |
|
| Dislikes |
| 1 | 0.000 | 0.000 | 0.000 | 0.9880 |
|
| Video length |
| 1 | 0.342 | 0.342 | 2.147 | 0.1449 |
|
| Views |
| 1 | 0.073 | 0.073 | 0.458 | 0.4996 |
|
| Typology |
| 4 | 5.019 | 1.255 | 7.887 | 0.0000 | *** |
| Content type | D1 | 1 | 0.712 | 0.712 | 4.475 | 0.0360 | * |
|
| D2 | 1 | 1.267 | 1.267 | 7.965 | 0.0054 | ** |
|
| D3 | 1 | 0.088 | 0.088 | 0.555 | 0.4574 |
|
|
| D4 | 1 | 0.826 | 0.826 | 5.194 | 0.0241 | * |
|
| D5 | 1 | 0.000 | 0.000 | 0.000 | 0.9964 |
|
|
| D6 | 1 | 0.265 | 0.265 | 1.667 | 0.1986 |
|
|
| D7 | 1 | 0.133 | 0.133 | 0.836 | 0.3620 |
|
|
| D8 | 1 | 0.088 | 0.088 | 0.554 | 0.4579 |
|
|
| D9 | 1 | 0.755 | 0.755 | 4.744 | 0.0310 | * |
|
| D10 | 1 | 0.025 | 0.025 | 0.155 | 0.6941 |
|
|
| D11 | 1 | 0.021 | 0.021 | 0.133 | 0.7160 |
|
| Residuals |
| 151 | 24.020 | 0.159 |
|
|
|
| GAM for DISCERN score | |||||||
|
|
|
|
|
|
|
|
|
| ANOVA for parameter effects |
| DF | Sum Sq | Mean Sq | F value | Pr(>F) | Signficance |
| Likes |
| 1 | 0.339 | 0.339 | 0.332 | 0.5651 |
|
| Dislikes |
| 1 | 3.175 | 3.175 | 3.112 | 0.0798 | |
| Video.length |
| 1 | 14.520 | 14.520 | 14.233 | 0.0002 | *** |
| Views |
| 1 | 1.388 | 1.388 | 1.361 | 0.2453 |
|
| Typology |
| 4 | 24.418 | 6.105 | 5.984 | 0.0002 | *** |
| Content type | D1 | 1 | 8.104 | 8.105 | 7.944 | 0.0055 | ** |
|
| D2 | 1 | 8.693 | 8.693 | 8.521 | 0.0040 | ** |
|
| D3 | 1 | 1.706 | 1.706 | 1.672 | 0.1979 |
|
|
| D4 | 1 | 8.194 | 8.194 | 8.032 | 0.0052 | ** |
|
| D5 | 1 | 2.682 | 2.682 | 2.629 | 0.1070 |
|
|
| D6 | 1 | 0.356 | 0.356 | 0.349 | 0.5555 |
|
|
| D7 | 1 | 0.086 | 0.086 | 0.084 | 0.7724 |
|
|
| D8 | 1 | 0.030 | 0.030 | 0.030 | 0.8638 |
|
|
| D9 | 1 | 4.795 | 4.795 | 4.700 | 0.0317 | * |
|
| D10 | 1 | 0.210 | 0.210 | 0.206 | 0.6507 |
|
|
| D11 | 1 | 0.006 | 0.006 | 0.006 | 0.9385 |
|
| Residuals |
| 151 | 154.045 | 1.020 |
|
|
|
Significance codes: *** <0.001; ** <0.01; *<0.05
ANOVA = analysis of variance;GAM = generalized additive model;JAMA = Journal of the American Medical Association.
Table 8: Linear regression model summary for Global Quality Score
| Parameter effects |
| Estimate | Std. error | T value | Pr(>|t|) | Significance |
| Intercept |
| 1.76 | 0.196 | 8.999 | 0.0000 | *** |
| Likes |
| 0.00 | 0.000 | 0.470 | 0.6389 |
|
| Dislikes |
| 0.00 | 0.001 | 1.371 | 0.1724 |
|
| Video length |
| 0.01 | 0.006 | 1.795 | 0.0747 | . |
| Views |
| 0.00 | 0.000 | 0.660 | 0.5101 |
|
| Typology2 |
| 0.28 | 0.223 | 1.253 | 0.2121 |
|
| Typology3 |
| 0.06 | 0.258 | 0.217 | 0.8284 |
|
| Typology4 |
| 0.39 | 0.208 | 1.896 | 0.0599 | . |
| Typology5 |
| 0.22 | 0.216 | 1.041 | 0.2997 |
|
| Content type | D1 | 0.46 | 0.121 | 3.780 | 0.0002 | *** |
|
| D2 | 0.44 | 0.136 | 3.215 | 0.0016 | ** |
|
| D3 | 0.09 | 0.161 | 0.534 | 0.5938 |
|
|
| D4 | 0.42 | 0.160 | 2.660 | 0.0086 | ** |
|
| D5 | 0.23 | 0.205 | 1.114 | 0.2671 |
|
|
| D6 | 0.04 | 0.176 | 0.251 | 0.8024 |
|
|
| D7 | 0.17 | 0.123 | 1.369 | 0.1729 |
|
|
| D8 | 0.27 | 0.264 | 1.038 | 0.3009 |
|
|
| D9 | 0.85 | 0.270 | 3.135 | 0.0021 | ** |
|
| D10 | 0.19 | 0.114 | 1.668 | 0.0974 | . |
|
| D11 | 0.08 | 0.264 | 0.303 | 0.7622 |
|
| R2 : 0.4796 |
|
|
|
|
|
|
| Adjusted R2 : 0.4141 |
|
|
|
|
|
|
Significance codes: *** <0.001; ** <0.01; * <0.05
Discussion
Hispanic people are the largest minority group in the USA, and nearly one-third identify as foreign-born.23 According to estimates from the United States Census Bureau, approximately 58 million Americans, or nearly 19% of the total population, identified as Hispanic or Latino in 2016, and this is expected to double over the next four decades.24 Additionally, data from the North American Central Cancer Registries (NACCR) showed that Hispanic females were less likely than non-Hispanic whites to be diagnosed with localized stage breast cancer (57% versus 65%, respectively).25 Another study also found that Hispanic women were less likely than non-Hispanic white women to present with stage I disease.26 This difference has been hypothesized to be related to the fact that Hispanic people, on average, belong to communities of lower socioeconomic status, which tend to have inadequate access to care.27 Individuals in lower socioeconomic groups are also less likely to be insured. One study, using data from the National Cancer Database, found that uninsured and Medicaid-insured patients had higher proportions of distant stage cancer at presentation than those with private insurance, or Medicare plus supplemental insurance.28 Data from the NACCR also show that the incidence of breast cancer among Hispanic women increased from 2006 to 2015, at an average rate of 0.4% per year. Other studies have also suggested that Hispanic women are less likely than non-Hispanic white women to receive appropriate and timely breast cancer treatment and are more likely to be diagnosed at an advanced stage.29,30 One multi-institutional analysis of breast cancer found, in addition to confirming the aforementioned differences in stage at presentation compared with non-Hispanic populations, that Hispanic women were more likely to present with triple-negative breast cancer (an aggressive subtype of breast cancer) and were less likely to receive breast-conserving surgery than non-Hispanic women.31
Interestingly, foreign-born Hispanic women experience lower rates of breast cancer compared with USA-born matched controls. This is thought to be related to reproductive factors such as younger age at first birth, higher parity, higher rates of breast cancer, and less use of hormone therapy for contraception and menopause, which confer a reduced risk of breast cancer.32 However, lower screening rates may also explain the decreased prevalence in Hispanic women in the USA compared with non-Hispanic white women in the USA and the reduced prevalence in foreign-born Hispanic women compared with USA-born Hispanic women.33,34
Screening for breast cancer occurs less frequently in Hispanic women than in non-Hispanic white women.35 Data from the National Health Interview Survey show that the prevalence of screening mammography was 61% in Hispanic women, compared with 65% in non-Hispanic white women.
With over 2 billion users in over 100 countries, YouTube has become an increasingly important source of health information for patients and physicians.6 As the platform grows in popularity, so does the number of videos published on medical topics. Previous studies have assessed the quality of videos concerning breast self-examination, mammography and mastectomy in English, using the same tools we utilized.11,15,16 Other studies have also assessed the quality and reliability of information found in videos on various medical topics, from lumbar spinal fusion to food allergies.36 As a company, YouTube employs community guidelines enforced by human reviewers and machine learning technology, in an attempt to “make YouTube a safer community” while still giving creators the freedom to share a broad range of experiences and perspectives.37 YouTube’s community guidelines outline which type of content is kept off the platform and covers a broad range of topics, including spam and deceptive practices, sensitive content, violent or dangerous content, regulated goods, and misinformation.37 Notably, YouTube’s community guidelines are fluid and continually changing in the midst of recent political trends and misinformation in the setting of the COVID-19 pandemic.
To our knowledge, this is the first study that analyses the quality, reliability and content of online videos relating to breast cancer exclusively in Spanish. On average, the videos examined in this study were viewed more than 128,000 times, demonstrating the popularity of the videos among the Spanish-speaking community. However, the unregulated nature of videos posted on this platform raises concerns about the quality and reliability of material available to the patient population. Our study demonstrates low JAMA, GQS and DISCERN scores for videos uploaded in Spanish. Notably, no video achieved the maximum possible scores for JAMA or GQS. When the scores of the videos were stratified according to typology, we found differences amongst upload sources to be statistically significant, with those uploaded by professional organizations having the highest mean rank scores. Professional videos had the highest mean rank for JAMA score and GQS, while the highest mean rank for DISCERN scores was recorded for ‘health portal’ videos. When stratifying the content of videos by typology, we found that roughly half of the videos uploaded by a ‘professional’ typology discussed treatment modalities and one-quarter of the videos spoke about the signs and symptoms found in indiviuals with breast cancer. The remaining content categories, including screening, risk factors, diagnosis, advocacy, breast cancer in men, disease pathophysiology, and types and stages, were addressed in only a small percentage of videos. However, this topic was found in higher frequency in other video typologies of lower quality. We also found that only approximately 10% of videos were uploaded from a source in the USA, with Spain and Mexico generating most of the videos.
Several limitations of our study exist. Firstly, our search strategy (“cancer de mama”) may not capture what patients search for on YouTube for information. Secondly, we only examined 200 YouTube videos, despite thousands of videos resulting when our search strategy was employed. This likely excluded mostly videos classified as ‘personal’. Other limitations of our study include the lack of data collection pertaining to the average number of views per video and the specific source of content provided. Lastly, two reviewers reviewed the videos. While there was only a minimal discrepancy in scoring between the two viewers, including additional viewers may have added to the validity of the scores given to each video.
Conclusion
Our study aimed to evaluate the quality and reliability of breast cancer videos produced in Spanish and found on YouTube, the most popular social media platform, with over 2 billion active users. We found that the overall quality and reliability of videos in Spanish were poor, and those of higher quality did not reliably cover some of the subjects. This is particularly important to federal agencies such as the National Institutes of Health and the National Cancer Institute, and academic institutions, where efforts have been made to recruit Hispanic patients with cancer and reduce disparities. The importance of social media platforms in the Hispanic community should not go unrecognized. Providing high-quality and reliable health information through videos targeting Hispanic people can be a helpful modality in strengthening the recruitment of these individuals to educate them on their illness so that they can ultimately make more informed decisions with their physician. Considering the growing Hispanic demographic in the USA and worldwide, hospitals and specialists should consider producing educational videos to increase the number of high-quality videos found online and dilute those promoting scientifically unsubstantiated information. A mechanism to achieve this may be via a peer-review process, which is employed in the publishing of patient information by Cancer.Net, the American Society of Clinical Oncology’s patient information website.38
The lack of high-quality videos covering these topics from a reputable source is concerning. We believe false or misleading information in all subjects, especially those not broadly covered, contributes to public misperception and may result in ill-informed and potentially harmful decision-making. The importance of accurate and reliable information becomes especially relevant in socioeconomically disadvantaged groups with inadequate health literacy and who may rely heavily on video media for their medical information. For videos published by non-professional sources, the HONcode is a certification system that exists and could be utilized by YouTube. The HONcode is a non-governmental organization with a code of ethics that guides website managers on how best to disseminate reliable and high-quality health information and provides yearly assessments for websites seeking its certification.39
Moving forward, major academic institutions and national organizations should conduct a comprehensive needs assessment to ensure accurate information is thoroughly presented for patients and their families.