In myelodysplastic syndrome (MDS), iron overload (IOL) is the result of multiple red blood cell (RBC) transfusions and increased iron absorption. The cause for the latter is low hepcidin levels due to an ineffective erythropoiesis.1 Increased iron absorption contributes to IOL, but chronic RBC transfusions are considered the main cause of IOL.2 IOL can lead to liver fibrosis, cirrhosis and heart failure. Patients with MDS are often elderly people with pre-existing co-morbidities which can worsen the clinical symptoms of anaemia and lead to the need of RBC transfusions. Cardiac failure and liver failure have been reported in 24% and 6.7% of patients, respectively; most likely as the result of heavy transfusion dependency.3
Serum ferritin (SF) works as a surrogate marker for IOL in MDS. It is usually recommended to start iron chelation when the patient has had 20–25 units of RBC transfusions, and SF exceeds 1,000 μg/l in patients with lower risk MDS.2 SF can be affected by other conditions such as infection and cancer. To determine the stage of liver fibrosis or liver iron content a liver biopsy or magnetic resonance imaging (MRI) T2* is required. Both procedures are time-consuming, but due to the risk of bleeding, a liver biopsy is almost never performed on MDS patients.4
Transient elastography (TE), also known as FibroScan® (Echosens, Paris, France), is a noninvasive method which measures the stiffness of the liver as a surrogate for liver fibrosis. Liver stiffness is determined by the velocity of a shear wave sent through the liver using a probe. Liver stiffness measurements (LSM) are expressed in kilopascal (kPa); the higher the value the stiffer tissue.5 A normal value is approximately 5 kPa.5 TE has no side-effects or complications and is easy to perform. TE has a high reproducibility with a high inter- and intra-observer agreement.6 The failure rate of TE has been reported to 2.4–9.4%.7 The cause of failure is often obesity.7 Conditions with inflammation, extrahepatic cholestasis and congestion can also affect the result since these conditions can constitute space-occupying difficulties and interfere with LSM.5
TE originates from studies on liver fibrosis in patients with hepatitis C virus (HCV)8 and hepatitis B virus (HBV) infection,9 and has been extensively investigated in patients with HCV infection. In HCV and HBV, fibrosis is considered either absent or mild when values are ≤7 kPa.5 In haematology, TE for the detection of liver fibrosis has been investigated in patients with IOL caused by different diseases10,11 and in thalassemia12–18 and haemochromatosis exclusively.19,20 TE has also been investigated in patients undergoing stem cell transplantation (SCT) with the aim of detecting complications affecting the liver in connection to SCT.21,22
The purpose with the present study was to assess whether TE could be a useable tool in evaluating liver fibrosis caused by IOL in MDS.
Patients and methods
Patients at the Department of Hematology, University Hospital of Copenhagen, Roskilde were screened for inclusion if they had MDS or chronic myelomonocytic leukemia (CMML) with dysplastic features, acute myeloid leukemia (AML) progressed from MDS or myelodysplastic/ myeloproliferative neoplasm, unclassifiable (MDS/MPN). Patients were excluded if they had a known history of alcoholic liver disorder, a known chronic infection with HBV or HCV, or any other known liver disorder. Patients were also excluded if they had a body mass index (BMI) of 30 or higher. Patients were enrolled after written informed consent. The study was approved by the local ethics committee of Region Sjaelland, Denmark and performed according to the Declaration of Helsinki.
Sixty patients were prospectively included and had their LSM measured with TE with the medium (M)-probe (FibroScan). A median LSM was considered valid when the following criteria were achieved: at least 10 valid measurements, a success rate ≥60% and interquartile range (IQR) <30%. These criteria were the same as in other studies.13,15,17,18 If the TE result was invalid, a new TE was performed until the criteria were fulfilled. BMI was calculated on the same day as the performance of TE. Patients were considered fasting if they had not ingested food for 2 hours prior to the examination. All patients had their SF and alanine aminotransferase (ALAT) measured. Most patients had their SF measured within one day of the FibroScan, but some out-patients had their SF measured up to 19 days before or after the day of the FibroScan. Patients were grouped according to the level of SF. SF was considered elevated when above 320 μg/l [17–320 μg/l] in men and 161 μg/l [5–161 μg/l] in women. ALAT was also measured and considered elevated in men when above 70 U/l [10-70 U/l] and above 45 U/l [10-45 U/l] in women. Patients were grouped according to transfusion dependency and independency.23 Time since diagnosis was calculated in number of months.
Risk scores were calculated according to the International Prognostic Scoring System (IPSS) and according to the revised IPSS (IPSS-R). IPSS and IPSS-R were calculated according to time of diagnosis and time of TE. At time of TE blast percentage was obtained from the bone marrow description closest to the date of TE.
Statistical analysis was performed using R statistics (R version 3. 1. 2 for Windows Copyright (C) 2014 The R Foundation for Statistical Computing). One calculation was also analysed with SPSS (SPSS version 20) for validation of result. Non-parametric statistics were used. Mann-Whitney U-test was performed when comparing medians, and Spearman’s test was used when performing correlation analysis.
Results
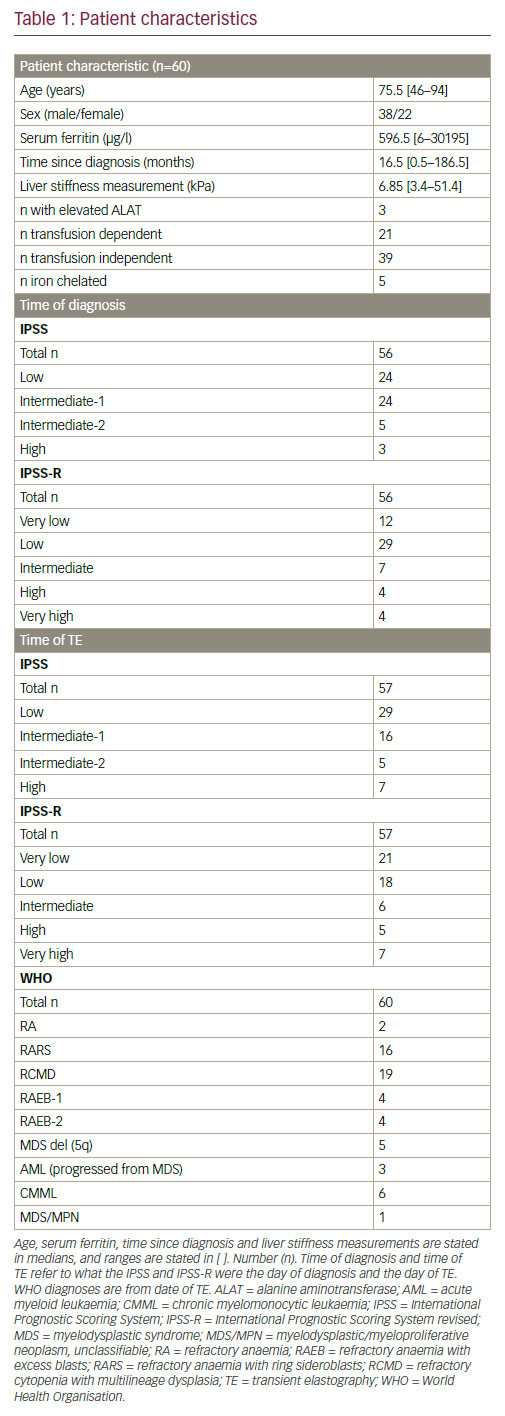
Eighty-nine patients were screened for inclusion. Twenty-nine patients were excluded. Among those, 14 had a BMI ≥30, five had a history of alcoholism, one had a chronic HCV infection and three had a history of another liver disease (haemochromatosis, hepatomegaly and portal hypertension). Six patients did not wish to participate. Sixty patients were prospectively included. Patients’ characteristics are given in Table 1. Among the included, one had a former HCV infection and one had a former HBV infection. A successful FibroScan was achieved in all 60 patients, and all FibroScans were performed by the same observer. Seventy-eight percent of the patients had the TE performed during fasting. Ninety-two percent had their TE performed and their SF measured as out-patients. Calculation of IPSS and IPSS-R at diagnosis were not possible in four patients. Three patients lacked cytogenetics, and one patient’s blood results at diagnosis were not retrievable. IPSS and IPSS-R at time of TE were not possible in the same first three patients due to lack of cytogenetics. Seventy-five percent of the patients were at the date of the TE low or intermediate-1. Median LSM for the entire cohort was 6.85 kPa. Fourty-seven percent of the patients had LSM above 7 kPa. The median age in the transfusion dependent group (76 years, range: 50–89) was similar to the transfusion independent group (75 years, range: 46–94).
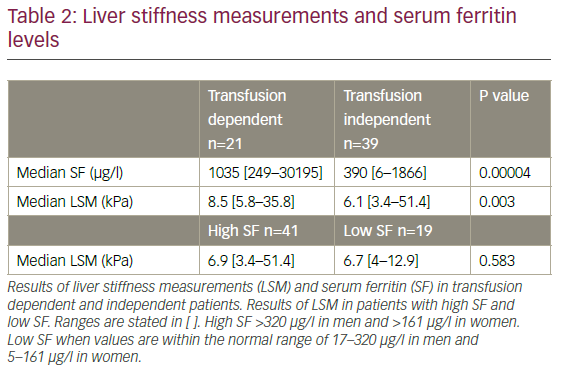
A positive correlation between time since diagnosis and SF (p=0.001) was observed. SF was significantly higher in those patients who were transfusion dependent compared to those who were transfusion independent (p=0.00004), and LSM was also significantly higher in the transfusion dependent group compared to the transfusion independent group (8.5 kPa versus 6.1 kPa; p=0.003) (Table 2). However, LSM was not significantly higher in patients who had elevated SF compared to those with normal SF (p=0.583) (Table 2), and there was no positive correlation between SF and LSM (p=0.103). There was no correlation between time since diagnosis and LSM (p=0.886). Two patients had notably high LSM. One was transfusion dependent and the other transfusion independent. One patient who also had lung cancer, had a notably high SF.
Only three out of the 60 patients had elevated ALAT, and therefore comparison of the two groups was not possible. All three patients with elevated ALAT were transfusion dependent with an elevated SF, and two of them also had an LSM above 7 kPa.
Five of the transfusion dependent patients were on iron chelation, and among these four had refractory anaemia with ring sideroblasts (RARS), and one had refractory cytopenia with multilineage dysplasia (RCMD). In the chelated patients, SF ranged from 686–2356 μg/l, and LSM ranged from 6.8 to 35.8 kPa of which only one had a LSM below 7 kPa.
Discussion
TE is an easy and noninvasive procedure. It is a well-known and common procedure in patients with HCV and HBV when evaluating liver fibrosis. In the present study we applied this standardised method in patients with myelodysplasia. The median LSM was 6.85 kPa, similar to the study by Poustchi et al., who found a median LSM of 6.7 kPa,18 and a rather large amount of patients had a LSM above 7 kPa. The present study aimed at investigating whether TE could be a credible candidate in evaluating liver fibrosis caused by IOL in MDS. We found that the transfusion dependent patients had a higher median LSM (8.5 kPa) compared to those who were not transfusion dependent (6.1 kPa), irrespective of SF level. We did not find any correlation between SF and LSM, nor did we find that patients with a high SF had significantly higher LSM compared to those with low SF. We did not find any correlation between time since diagnosis and LSM.
A strength of the present study was that the included patients had BMI below 30 which explains the high TE success rate of 100% and more reliable results. The majority of the patients were fasting which also presumably contributes to more reliable results. This study also included a majority of low-risk patients (75%) who would normally be potential candidates for iron-chelation. This study excluded patients with a present HBV and HCV infection in order to render probable the evaluation of fibrosis caused by IOL.
An essential limitation of the study was the fact that it is a cross-section design and the use of SF. It is questionable that one single measurement
of SF can reflect the consequences of IOL over time versus sequential SF measurements. SF is a vulnerable marker for IOL since other aetiologies can have an impact on its value. Since five of our patients had their TE performed during hospital admission, the SF levels in these patients are less reliable. Two patients had a very high LSM. We cannot be certain that these two outliers had an untold history of alcoholism which could have influenced the result. The five chelated patients in the study all had an elevated SF, and all but one had LSM above 7 kPa. The fact that five were on iron chelation could also have influenced the result since it is most likely that without iron chelation the SF values would have been even higher, and perhaps there would have been more IOL leading to higher LSMs as a result of more liver fibrosis. A weakness of the present study is the fact that we did not compare LSM to measurements of liver iron content such as with MRI T2* since this was not possible within the framework of the present work. The present study does not account for the frequency of transfusions in a time perspective nor does it take comorbidity, besides obesity, into account.
LSM was compared in patients who were transfusion dependent versus transfusion independent, and a significant difference was found. This indicates a higher occurrence of liver fibrosis in the transfusion dependent group. Even though a difference was found, the ranges were very wide in the two groups. Elderly MDS patients are often in greater need of transfusions. However, the median age was similar in the two groups.
Two studies have evaluated patients with IOL with TE which had one and four patients with MDS included respectively.10,11 Mirault et al. found among 15 patients with IOL, no association between SF and LSM, which is in agreement with the finding of the present study. The same study did find a correlation between LSM and liver fibrosis stages according to histology.10
In thalassemia, as in MDS, SF is used as a marker for IOL and guides when to start iron chelation. There are several studies on TE and thalassemia.12–18 Cassinero et al.15 and Musallam et al.16 found an improvement in LSM in chelated patients. In a study by Poustchi et al., LSM was evaluated in regularly transfused patients with β-thalassemia either major or intermedia. In line with the present study, they found no correlation between LSM and SF, and no significant difference in LSM when dividing in to levels of SF. However, all the included patients also had HCV.18 Elalfy et al. and El-Asrar et al. found a positive correlation between SF and LSM measured by TE in patients with β-thalassemia major, which is in disagreement with the findings of the present study. Almost half of the included patients also had HCV.13,17 Di Marco et al. found, as in the present study, no correlation between SF and LSM among 53 patients with β-thalassemia major who were regularly transfused. They did, on the other, hand find a significant correlation between LSM and liver fibrosis evaluated by liver biopsy. Twenty-three of the patients were HCV-RNA positive.14 Interestingly Elalfy et al.13 and Di Marco et al.14 both found a significant difference in LSM between HCV positive and HCV negative, whereas El-Asrar et al.17 did not. The above contradictory findings question whether it is the IOL expressed in SF, HCV or the presence of both that influence the TE result.
Among the above mentioned studies on thalassemia some have also correlated LSM with liver iron concentration (LIC) measured with MRI.12,13,18 Elalfy et al.13 found a positive correlation, whereas Fraquelli et al.12 and Poustchi et al.18 did not. The presence of HCV infection in a large proportion of the included patients in the mentioned studies makes it difficult to draw any conclusion in relation to present study since the presence of HCV must expect to influence the LSM results.
Studies evaluating IOL with MRI T2* in patients with MDS have also found diverging results.24,25 One study found that liver R2* was positively correlated with SF and number of units transfused. However cardiac R2* was not.24 Another study did not find correlation between liver IOL and SF or number of RBC transfusions.25 These findings support that SF is a marker which can vary, and perhaps LSM and liver iron are also. Therefore, findings are not always consistent.
In two studies on SCT two and ten of the included patients had MDS respectively.21,22 These studies evaluated liver injury (hepatic graft-versushost disease [GvHD], drug-induced liver injury, veno-occlusive disease, liver toxicity) with TE.21,22 One study found that TE could discriminate selected cases with severe complications after allogenic SCT transplantation. However, TE failure rate was 30.5% with the M-probe.22
The other study found that LSM correlated with liver enzyme values before transplantation and with liver enzyme values in patients with more severe liver toxicity after transplant.21 These findings strengthen our conclusion that LSM may be a useful tool in monitoring liver damage in MDS. However, the present study evaluates LSM as a surrogate for liver fibrosis which TE is validated for.
To our knowledge this is the first study which describes LSM measured by TE in a more homogenous IOL group consisting of patients with myelodysplasia. The dissimilarity in SF correlation to LSM between the present study and the studies on thalassemia13,17 may be explained by the fact that MDS patients are very heterogeneous in co-mobidity compared to young people with thalassemia. Elderly patients with MDS could also have high SF caused by other diseases which may explain the lack of correlation between SF and LSM. Co-morbidities such as heart failure leading to congestion or other conditions affecting the liver could perhaps themselves influence the TE result.
Transfusion dependency is indeed a main cause of IOL, and LSM may be a good indicator of liver fibrosis in MDS. Whether liver fibrosis itself caused by IOL as opposed to cytopenia and leukemic transformation is of importance of survival in MDS needs further explanation. We speculate that TE could be of interest in low-risk MDS patients who have a prospect of continuous need for RBC transfusions. We also speculate that TE is mainly of value in the heavily transfused MDS patients. The utility of TE for the detection of liver fibrosis caused by IOL in MDS could be used either as a supplement to MRI T2* or screening tool before moving on to MRI T2* or liver biopsy. However, we do not have the relevant data to support this. To further clarify whether TE is a useable and reliable tool in monitoring IOL and the clinical meaning of it, longitudinal studies are warranted.